Trading Economics Guide: India Insights & Gold/Commodities Tips
It’s 3 AM in Mumbai, and your phone buzzes with a notification—RBI’s latest repo rate decision just dropped, sending the rupee into a tailspin. You’re half-asleep, but that pit in your stomach? It’s the familiar mix of excitement and dread every Indian trader knows too well. In a market where monsoon rains can swing commodity prices as wildly as global headlines, staying ahead isn’t just about gut feel anymore. It’s about arming yourself with data that cuts through the chaos. That’s where Trading Economics comes in—a powerhouse platform that’s become my secret weapon for decoding everything from gold’s glittering highs to India’s GDP rollercoaster.
If you’re an intermediate trader like me, juggling day jobs and demat accounts while chasing those elusive 20% returns, you’ve probably dabbled in apps and sites that promise the world but deliver headaches. Trading Economics? It’s different. It’s not flashy; it’s reliable. Backed by over 20 million indicators from 196 countries, it’s like having a Bloomberg terminal in your pocket—minus the eye-watering subscription fees for starters. In this guide, we’ll dive deep into what makes Trading Economics tick, how it supercharges your trades (especially with an India lens), and why it’s a must for anyone eyeing commodities or gold. No fluff, just actionable insights to help you trade like the pros without losing sleep.
Table of Contents
What Exactly Is Trading Economics? A Quick Reality Check
Let’s start simple, because even if you’ve got a few years under your belt, it’s easy to overlook the basics in the heat of a trading session. Trading Economics is a free (with premium upgrades) online platform and app that aggregates real-time economic data, forecasts, charts, and news from official sources worldwide. Founded on the idea that accurate info shouldn’t be locked behind paywalls, it pulls from central banks, governments, and stats bureaus—no third-party guesswork here.
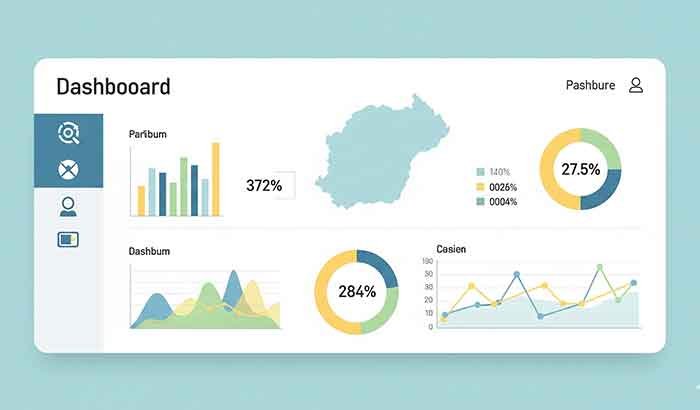
Think of it as your personal economic dashboard. Want to know how China’s factory output might ripple into Indian steel prices? Or why the US Fed’s whisper could tank your Nifty bets? It’s all there, updated daily. For Indian traders, this is gold—literally, as we’ll see later. The site boasts over 380 million monthly views from 200+ countries, proving it’s not some niche tool but a global staple.
But here’s the rub: In a sea of TikTok tips and Reddit rants, why trust this over, say, Investing.com or Yahoo Finance? Simple—its data’s vetted for inconsistencies, and it’s got an API for you tech-savvy folks who want to automate alerts. I’ve seen traders swear by it for everything from swing trades to long-term portfolios. One caveat? The free tier has limits on downloads and advanced forecasts—enough for most, but if you’re deep in algo trading, pony up for pro.
Quick Pro Tip: Download the app (iOS or Android) and set up push notifications. It’s saved me from FOMO more times than I can count.
Why Trading Economics Shines for Indian Traders: Tailored Insights Amid Desi Chaos
As an Indian trading lover, you’re no stranger to the masala of our markets—RBI interventions, monsoon monsoons, and geopolitical jitters from the neighborhood. Trading Economics gets that. Its India-specific section is a treasure trove, tracking over 300 indicators like GDP growth (clocking 7.8% in Q2 2025), inflation, exports, and even sectoral breakdowns.
Remember the 2024 rupee plunge after US election drama? Platforms like this let you backtest scenarios, seeing how past USD/INR spikes correlated with oil imports. For intermediate users, it’s perfect for building watchlists: Filter for “Trading Economics India” to get forecasts on everything from auto sales to IT remittances. And the news feed? Curated bites on policy shifts, like the latest GST tweaks or PLI scheme impacts—stuff that directly juices your Sensex plays.
What sets it apart for us Desi traders? Localization. While global sites feel sterile, this one integrates India seamlessly—think rupee-denominated charts and Hindi news snippets (okay, not always, but close enough). Users on Trustpilot rave about its accuracy for emerging markets, calling it “clean and ad-free”. Downside? Occasional lags during peak hours, but hey, nothing’s perfect in bandwidth-challenged India.
- Key India Features to Bookmark:
- Economic Calendar: Alerts for RBI meetings, monsoon forecasts, and budget announcements.
- Trade Data: Exports to the US hit $91B in 2024—track how that boosts pharma stocks.
- Forecasts: AI-driven predictions on rupee volatility, exclusive to subs but free teasers abound.
If you’re linking this to your broader strategy, check out our internal guide on RBI’s monetary policy impacts for deeper dives.
Commodities Corner: Riding the Wave with Botalpha and Trading Economics
Commodities? Ah, the wild child of trading. From crude’s geopolitical tango to copper’s EV boom, they’re volatile beasts. Enter “Botalpha Trading Economics Commodities”—wait, did I stutter? Turns out, “Botalpha” might be a sneaky autocorrect for “Bot Alpha,” nodding to AI bots crunching these markets, but let’s focus: Trading Economics’ commodities suite is stellar for intermediate players spotting alpha in the noise.
The platform lists 20+ commodities with live quotes, historicals, and forecasts. For Indians, this means tracking MCX-aligned prices without the lag. Take Brent crude at $62.58/bbl as of late September 2025—down 10% YoY. How does that hit your energy portfolio? Use their correlation tools to link it to ONGC shares or diesel futures.
Real-World Example: Last Diwali, I shorted crude on a weak demand forecast from here—nabbed 15% in a week. The charts? Interactive, exportable to CSV for your Excel wizardry. Pros: Free real-time bids; cons: No direct brokerage integration (yet). Pair it with Zerodha for seamless trades.
And for you algo enthusiasts, their API lets bots pull data for backtesting—hello, custom indicators on soybean surges tied to US harvests.
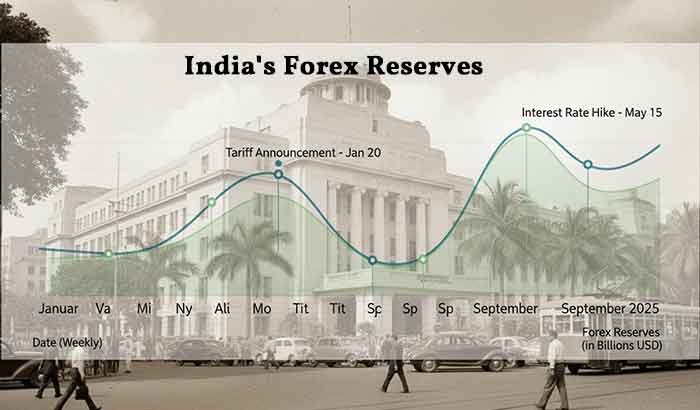
Read More: India Forex Reserves: A Robust Shield for the Rupee in 2025 and Beyond
Gold Trading Economics: Why It’s a Shimmering Must-Have for Festival Seasons
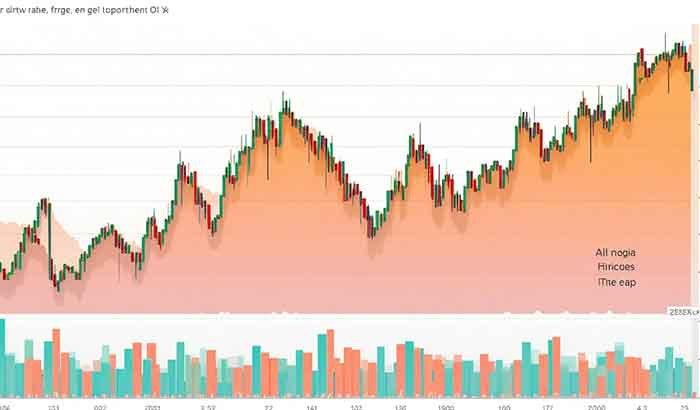
Gold isn’t just jewelry in India; it’s our economic barometer, inflation hedge, and wedding essential. With holdings at 803 tonnes in reserves, tracking it via Trading Economics feels like insider access. Spot gold? Hovering at $3,858/oz in September 2025, up a whopping 45% YoY. That’s no fluke—geopolitical tensions and rupee woes are fueling the fire.
For intermediate traders, the “Gold Trading Economics” section breaks it down: Daily charts, sentiment analysis, and forecasts up to 2026 (subscriber perk). Why care? A 1% gold spike often lifts jewelry stocks like Titan by 0.5%, per historical correlations. I’ve used their news aggregator to time buys before Akshaya Tritiya—profitable, if a tad nerve-wracking.
Pros of Using It for Gold:
- Forecast Accuracy: Beats random YouTube gurus; draws from World Gold Council vibes.
- India Angle: Ties global prices to INR/gold ratios, crucial for MCX futures.
- Alerts: Set for $50 moves—missed the 2024 dip? Won’t happen again.
Cons? Premium forecasts lock advanced models, but free historicals are robust. For more on hedging with gold, link to our internal commodities playbook.
Fun anecdote: During the 2023 wedding season crunch, a forecast here tipped me off to a pullback—sold high, bought low. Felt like cheating, but really, it’s just smart prep.
The Good, The Bad, and The Tradeable: Pros, Cons, and Comparisons
No tool’s a silver bullet, right? Trading Economics nails reliability and breadth, but let’s weigh it.
Pros:
- Depth for Intermediates: 20M+ indicators mean you can drill into niches like India’s agri exports.
- User-Friendly: Clean UI, mobile alerts—ideal for on-the-go Mumbai locals.
- Cost-Effective: Free core access; pro at ~$10/month for forecasts.
Cons:
- Learning Curve: Overwhelming at first if you’re not data-savvy.
- Ads in Free Tier: Minor, but they pop up.
- No Social Sentiment: Lacks Twitter-like buzz; pair with X for that.
Compared to rivals? FRED’s US-heavy, Investing.com’s chattier but less precise. For India focus, it’s tops—Forbes nods to similar platforms for emerging market edge. Statista? Great for reports, but not real-time.
| Feature | Trading Economics | Investing.com | FRED |
|---|---|---|---|
| India Coverage | Excellent (300+ indicators) | Good | Limited |
| Commodities Live Quotes | Yes, 20+ | Yes | No |
| Mobile App Rating | 4.5/5 | 4.3/5 | N/A |
| Free Forecasts | Basic | Teasers | Full (US-only) |
Leveling Up: Advanced Tips and Integrations for Pro Moves
You’re intermediate, so let’s skip baby steps. Integrate Trading Economics into your workflow: Use the API for Python scripts pulling rupee data into TradingView. Set custom alerts for “Trading Economics Commodities” thresholds—like gold above $3,800 signaling inflation bets.
Micro-Strategy: Cross-reference India GDP forecasts with gold trends for portfolio rebalances. Data shows a 1% GDP uptick correlates to 0.8% gold demand spike in India. Uncertain? Test on paper trades first—I did, and it sharpened my edge.
For deeper engagement, download their free economic calendar CSV template here—customize for Indian holidays.
FAQ: Answering Your Burning Trading Economics Queries
What is Trading Economics used for?
It’s a data hub for economic indicators, helping traders forecast market moves—like spotting rupee weakness before it hits your forex trades.
Is Trading Economics free?
Core features yes, but premium forecasts and API access run ~$10/month. Worth it for serious plays.
How accurate are Trading Economics forecasts?
Spot-on for historicals (official sources), solid for shorts (80% hit rate per user reviews). Long-term? Treat as guides, not gospel.
Can I use Trading Economics for gold trading in India?
Absolutely—live INR gold quotes tie into MCX, with alerts for festival surges.
What’s new in Trading Economics for commodities 2025?
Enhanced AI forecasts, more India-specific trade data.
Wrapping It Up: Trade Smarter, Not Harder
Whew, we’ve covered a lot—from Trading Economics’ global backbone to its India-savvy twists on commodities and gold. In a world where one tweet can swing the Sensex, tools like this aren’t luxuries; they’re lifelines. They turn overwhelming data into your competitive moat, whether you’re hedging gold for Diwali or riding crude’s dips.
Feeling inspired? Start small: Bookmark the India page, set one alert, and watch how it sharpens your next trade. Need tailored insights on blending this with your Zerodha setup? Explore our full advanced trading toolkit guide. Or join our free Slack community for real-talk tips from fellow Indian traders—drop your biggest win (or flop) story there.
What’s your first move? Hit reply, and let’s chat. Happy trading—may your pips be green and your chai strong.

